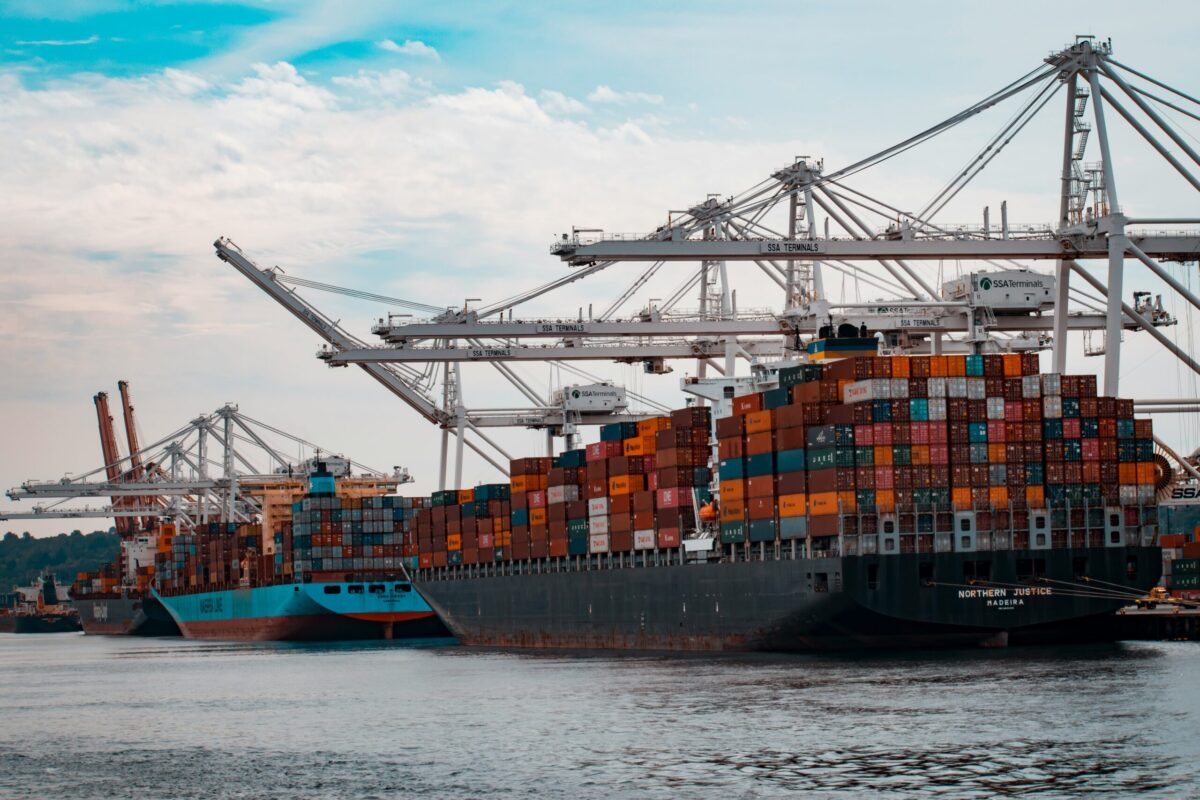
U.S. port activity has shown steady growth over the past year, driven largely by strong import volumes in late 2024 that carried into early 2025 before starting to level off. In 2024, container imports reached 28.1 million TEUs (up 12.8% from the prior year) reflecting the rebound in global supply chains. From January through June 2025, the nine largest U.S. ports handled 16.9 million TEUs, a modest 1.7% increase year-over-year. While monthly volumes remained strong, signs of cooling emerged in mid-2025 as economic pressures slowed momentum. Overall, ports still posted 5-10% growth compared to the previous year, underscoring their resilience even as demand patterns shifted.
Trends in U.S. Ground Logistics Activity (Sep. 2024 – Aug. 2025)
Ground logistics activity, encompassing trucking and rail freight, remained largely stagnant or slightly declining over the last 12 months, with fluctuating monthly volumes but no sustained upward momentum. Key indicators include:
ATA Truck Tonnage Index (seasonally adjusted):
This index, a primary measure of for-hire trucking volumes, hovered around 113 points, showing minimal net change. Monthly values from September 2024 to June 2025 (latest available) are detailed below; July and August 2025 data were not accessible, but trends suggest continued flatness.
| Month | Index Value | MoM % Change (Month-Over-Month) | YoY % Change (Year-Over-Year) |
| Sep 2024 | 112.9 | -2.09 | -0.88 |
| Oct 2024 | 113.5 | 0.53 | -0.35 |
| Nov 2024 | 112.6 | -0.79 | -0.71 |
| Dec 2024 | 112.4 | -0.18 | -2.94 |
| Jan 2025 | 112.4 | 0.00 | 0.36 |
| Feb 2025 | 114.2 | 1.60 | 3.54 |
| Mar 2025 | 113.4 | -0.79 | 0.09 |
| Apr 2025 | 113.4 | 0.09 | 0.09 |
| May 2025 | 114.4 | 0.88 | 2.14 |
| Jun 2025 | 113.3 | -0.96 | -0.26 |
The index rose slightly from 112.90 in September 2024 to 113.30 in June 2025 (a net +0.35% change), with peaks in February and May but offsets by declines. Full-year 2024 truck freight totaled 11.27 billion tons, down from 11.41 billion in 2023.
Cass Freight Index (Shipments Component):
This broader freight volume measure (including trucking and rail) declined overall, with shipments down 5-6% YoY in several months. For example, September 2024 shipments fell 1.7% MoM and 5.2% YoY; August 2024 rose 1.0% MoM but was down 1.9% YoY; July 2025 stood at 1.033. The latest available (potentially August 2025) was 1.006, down 1.68% MoM and significantly from 1.081 a year prior.
Freight Transportation Services Index (TSI):
From January to May 2025 (partial data), the index fluctuated between 136.9 and 138.5, ending at 137.0 with a net slight decline. Rail trends were mixed, with grain exports up 5.8% in the first half of 2025.
In summary, ground logistics activity was flat to down 1-3% overall, contrasting with port growth, as overcapacity and soft demand persisted amid economic uncertainty.
Comparison of Trends
Port activity outpaced ground logistics over the period, with ports benefiting from elevated import surges in late 2024 (e.g., pre-tariff stockpiling), while ground sectors faced overcapacity and weaker domestic demand. Ports grew 5-10% YoY on average, versus ground’s flat or -1-3% performance. This divergence highlights a disconnect: inbound ocean freight increased, but downstream distribution (trucking/rail) lagged due to inventory builds and economic softening.
Projection for Domestic Trucking Companies and 3PLs
Domestic trucking companies and 3PLs are likely to see modest volume increases starting in late 2025 (Q4) or early 2026, driven by market stabilization and potential shifts from tariffs. The ATA forecasts a 1.6% growth in truck volumes for full-year 2025 after two years of declines, rising to nearly 14 billion tons by the end of the decade. However, with port imports projected to drop 5-20% in the second half of 2025 due to tariffs, import-dependent trucking may face short-term pressure. Offsetting this, nearshoring, sustainability initiatives, and economic recovery could boost domestic freight, with gradual rate growth (2-5% YoY) amid tightening capacity. The 3PL market is expected to grow 3.5% to $246.25 billion in 2025, with annual CAGR of 1.85% through 2030. Uncertainty from policy changes suggests a challenging 2025, but recovery signals point to volume upticks by early 2026 as the industry emerges from the “Great Freight Recession.”
As these shifting port and ground transportation trends unfold, businesses need a logistics partner who can help them adapt quickly and strategically. At TOP Worldwide, we specialize in bridging the gap between ocean freight and ground distribution, ensuring your supply chain stays resilient no matter the market conditions. Whether you need drayage, full truckload, expedited freight, or customized 3PL solutions, our team is ready to keep your freight moving. Connect with us today to optimize your transportation strategy and stay ahead of industry challenges.
 Jeff Berlin
is the Chief Operating Officer of E.L. Hollingsworth & Co. and serves as the Senior Operations Executive for TOP Worldwide and Native American Logistics. With over 30 years of experience leading logistics and trucking companies, he brings deep industry expertise to his role. Jeff is also a CDL-A driver and a private pilot. Contact Jeff at jberlin@elhc.net.


